2024 ACEEE Summer Study on Energy Efficiency in Buildings

BETTER turns a building's monthly utility bills into a weather-normalized picture of how it uses energy, compares it with similar buildings, and recommends where to act first.
BETTER turns raw bills and basic building information into analysis-ready monthly data. Click a box to look inside.
Bills rarely line up with calendar months, so BETTER regroups them into monthly totals.
Unit prices come from the bills, or from state defaults when costs are missing.
The address becomes map coordinates, a state, and a ZIP code.
The nearest NOAA station supplies the monthly average temperatures.
Each month moves to its average outdoor temperature.
A change-point model is fitted to the points. Click a line or point.
Each part of the model is compared with peer buildings.
Pick a scenario. The dashed line is the improved model; the shaded area is the estimated energy savings.
BETTER needs at least 12 months of utility bills, plus the building's space type, floor area, and address. Click a box in the diagram, or a tab below, to see how BETTER prepares each input.
Bills are regrouped into monthly energy use and priced per fuel. The address is geocoded, and the coordinates are used to look up monthly temperatures and default energy prices. Together they give BETTER clean monthly data to analyze.
Bills can cover any billing period and come in different fuels and units. BETTER:
The address can be entered loosely, with or without a street, ZIP code, or country. BETTER sends it to the Google Maps geocoding service, which returns the building's coordinates, state, and ZIP code.
The coordinates are then used to find weather data and default energy prices.
BETTER ranks the NOAA weather stations near the building's coordinates and uses the closest one. Monthly average outdoor temperatures are loaded for the same months as the bills.
Each bill's unit price is its cost divided by its energy use. When a bill has no cost, BETTER uses a default price for that fuel in the building's state, or an international default outside the U.S.
These unit prices turn energy savings into cost savings later on.
BETTER uses regression techniques to analyze a building's monthly energy use in response to weather conditions in order to determine how much energy is weather-sensitive (heating and cooling), and weather-independent (lighting, plug loads, etc.). Normalized energy use data is fit to temperature patterns to determine whether heating and cooling set points are appropriate and whether equipment is performing for optimal energy efficiency.
A piecewise linear (change-point) model is fitted to the monthly points. Click a term, or a line or point on the chart.
The flat part of the model: monthly energy use that does not change with outdoor temperature, such as lighting, plug loads, and other equipment. A lower baseload means less weather-independent energy use.
The slope of the heating line: how much monthly energy use rises for each degree the average outdoor temperature drops below the heating change-point. A lower heating sensitivity means less energy used for heating.
The average monthly outdoor temperature below which energy use starts increasing with colder weather.
The slope of the cooling line: how much monthly energy use rises for each degree the average outdoor temperature climbs above the cooling change-point. A lower cooling sensitivity means less energy used for cooling.
The average monthly outdoor temperature above which energy use starts increasing with warmer weather.
Each part of the model is compared with a peer group, using the group's median and spread.
Peer group
Peer-benchmark: BETTER's reference statistics for the building's space type and country. Used for every single-building analysis.
Self-benchmark: statistics generated from the buildings you select in a portfolio analysis. Works best with at least 30 buildings.
Savings target
Conservative: The savings goal will be one standard deviation worse than the median performance of the benchmarking peer group.
Nominal: The savings goal will be equal to the median performance of the benchmarking peer group.
Aggressive: The savings goal will be one half standard deviation better than the median performance of the benchmarking peer group.
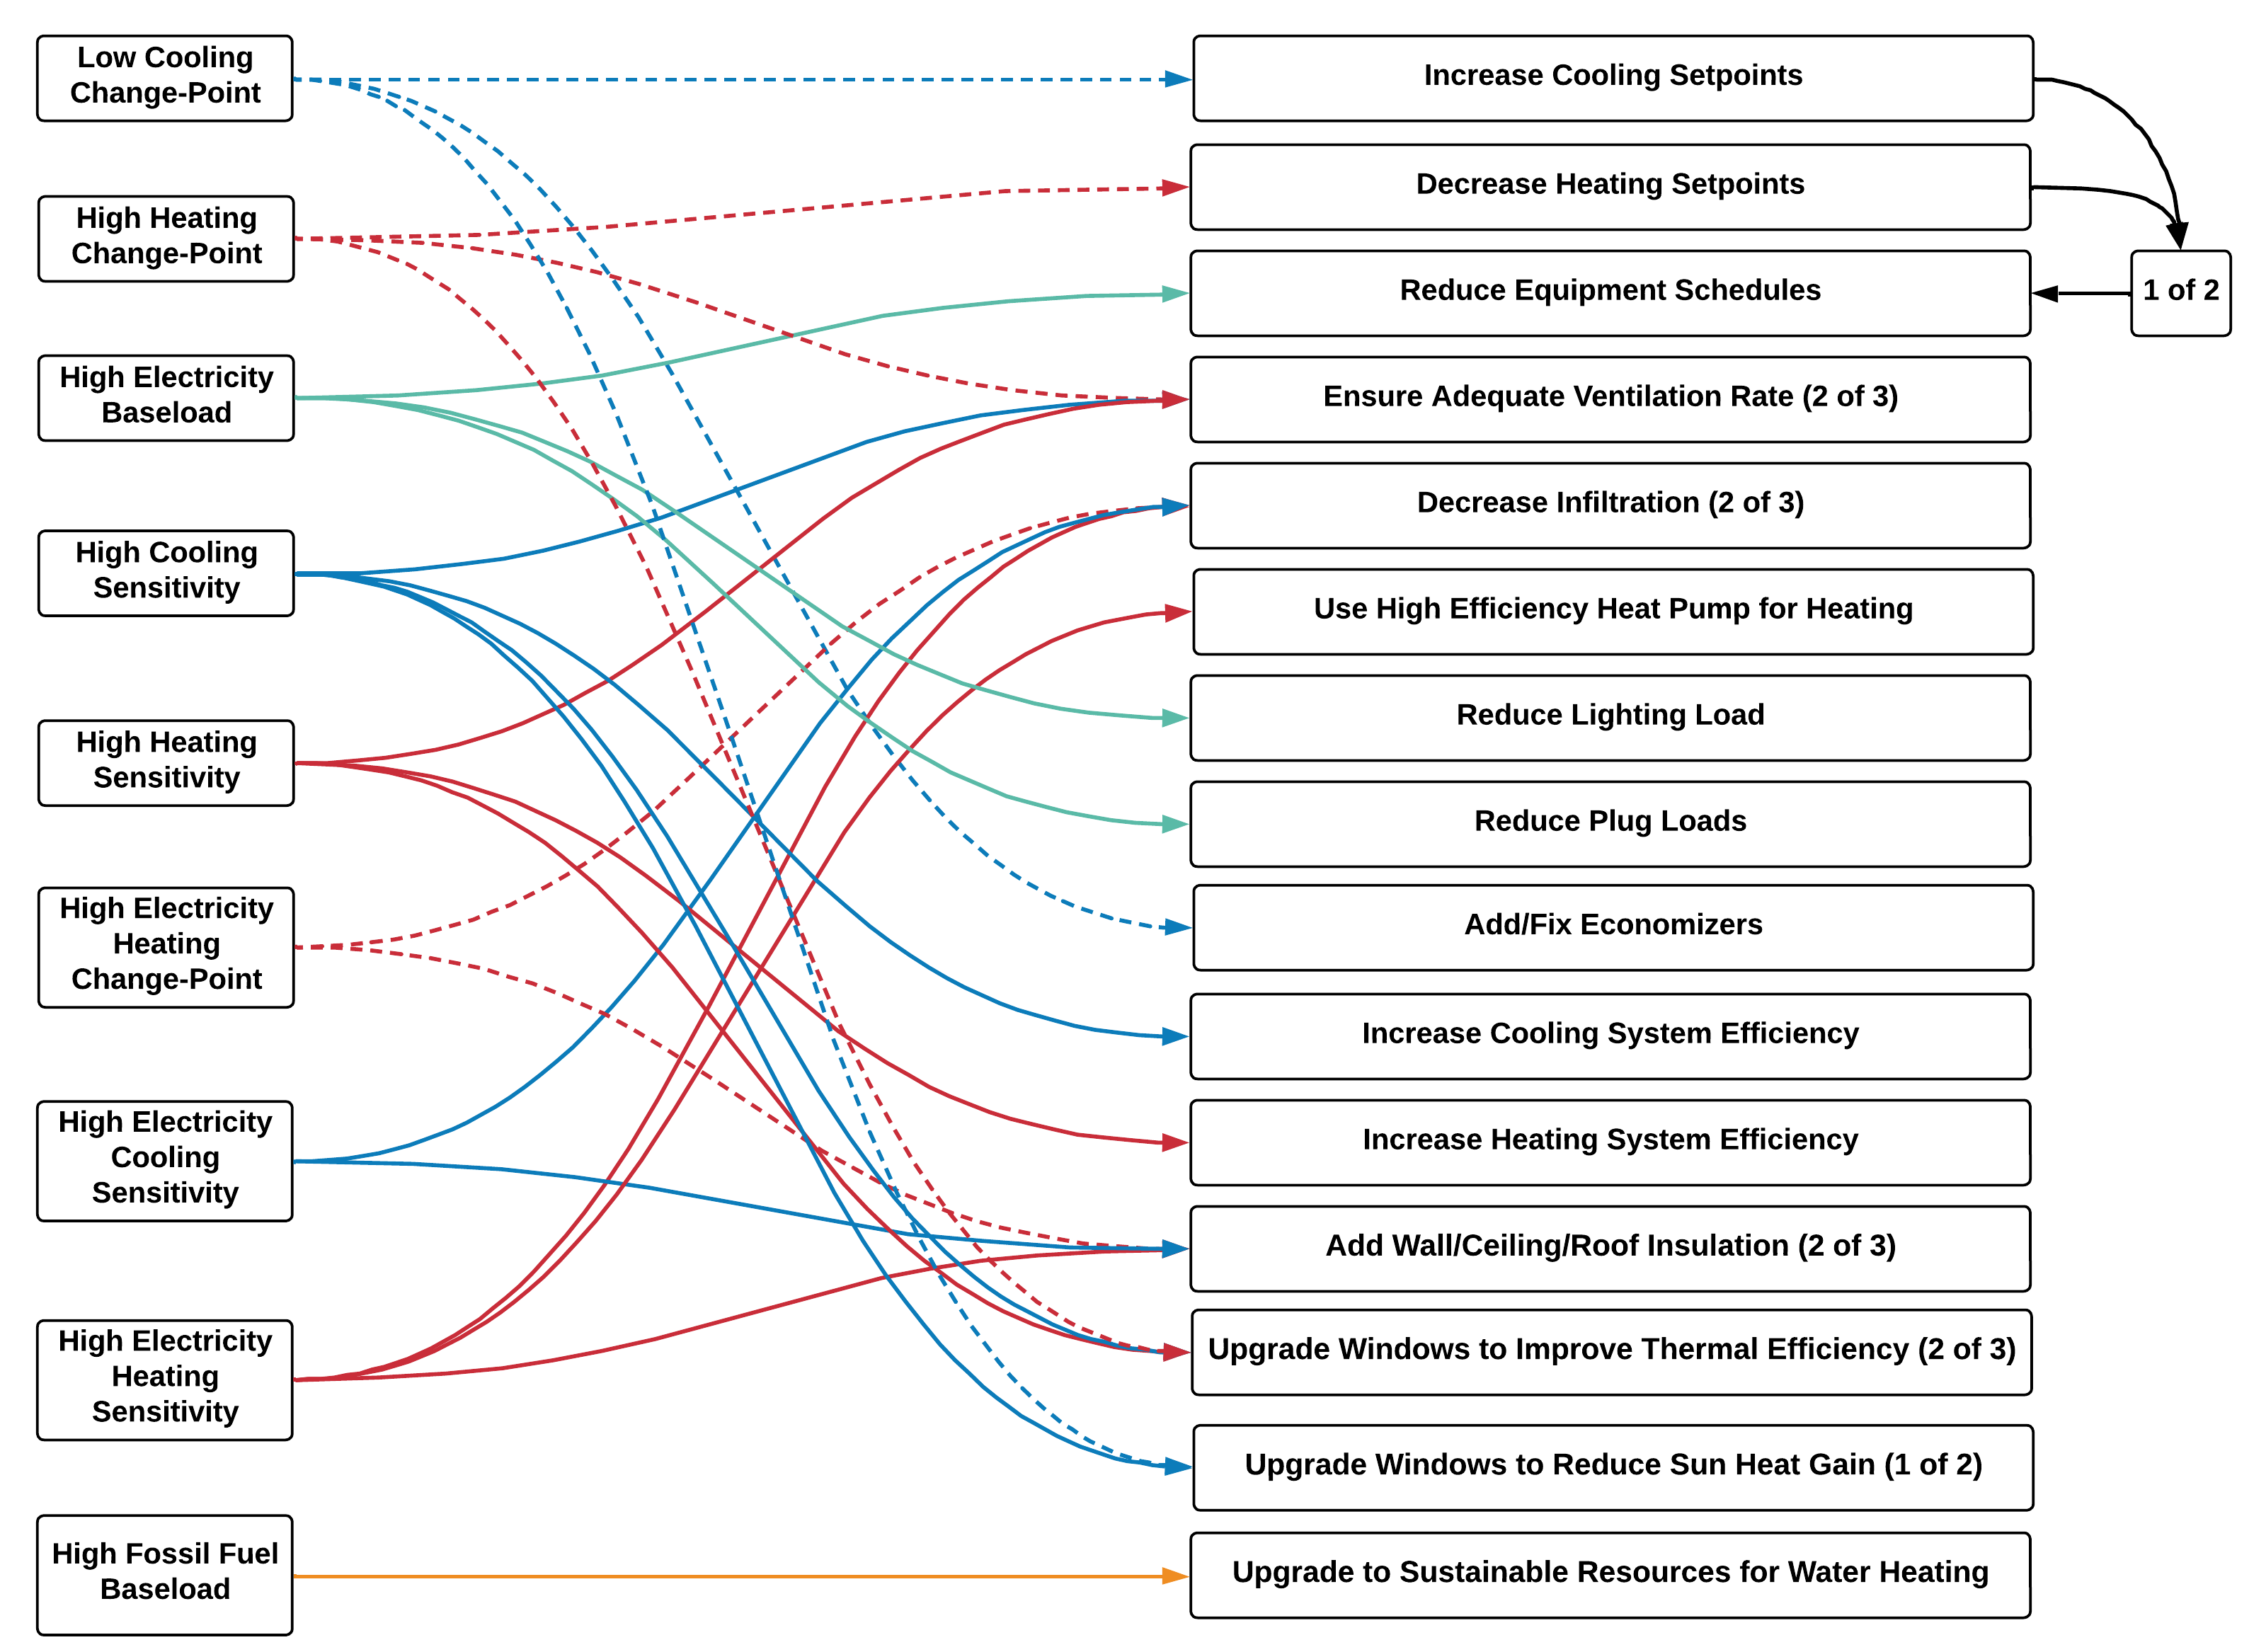
Each part of the model that falls short of peers points to specific measures. Pick a scenario to see how the model would change and what BETTER recommends.
The flat, weather-independent part of monthly energy use is lower.
Recommended measures
Monthly energy use rises less for each degree the average outdoor temperature drops below the heating change-point.
Recommended measures
Monthly heating energy starts increasing below a lower average outdoor temperature.
Recommended measures
Monthly energy use rises less for each degree the average outdoor temperature climbs above the cooling change-point.
Recommended measures
Monthly cooling energy starts increasing above a higher average outdoor temperature.
Recommended measures
When several parts fall short together, BETTER also suggests ventilation and envelope measures. See how model coefficients map to measures.
