BETTER can access weather data from the National Oceanic Atmospheric Administration (NOAA) for 8152 weather stations globally between 2010 and 2023. BETTER accesses weather files from NOAA that contain sub-hourly outdoor air temperature; aggregates these files in the BETTER database; and then calculates the average outdoor air temperature during a given billing period. We manually download the weather files about every month. However, due to the weather data update frequency of NOAA, the BETTER database may be missing some recent weather data. To address this issue, the latest version of BETTER downloads weather data from Open-Meteo "on-the-fly" for locations where weather data is not in the BETTER database yet.
BETTER only considers outdoor dry-bulb air temperature in weather normalization.
In many cases, buildings use natural gas as well as delivered fossil fuels, such as fuel oil. In those cases, we suggest "allocating" the delivered fuel to mimic the natural gas consumption profile in the building, so the billing start and end dates for the delivered fossil fuel will mimic the billing start and end dates of natural gas. Alternatively, if natural gas is not used by the building, you can approximate the billing start and end dates based on the fuel delivery dates.
BETTER works best when a user enters 12 consecutive months of energy usage and cost (for all fuels used in a building). However, if a user does not have monthly energy cost information, BETTER will estimate the monthly energy cost (based on monthly usage) for the following fuel types according to the fuel unit price information contained in the linked source files:
At this time, BETTER can only intake monthly energy usage data (broken down by fuel type). If you have smart meter data that quantifies energy usage at more granular intervals (e.g., hourly, daily, weekly), you will need to aggregate it to monthly energy usage. We are investigating adding capability to BETTER to read smart meter data and will announce it in our News section when available.
At this time, BETTER allows a user to input energy costs in the currencies linked here .
Note: Selecting a currency only enables BETTER to display costs in the selected currency, but not convert currency from one to another.
Although very rare, there may be instances where a building has no energy consumption during some billing periods. To ensure clarity in distinguishing between actual zero energy consumption and missing values in the data, a minimum threshold value of 0.001 is established. When users are certain that there was no energy consumption for a specific billing period, they are advised to input 0.001 instead of zero. This placeholder value enables the change-point model to appropriately account for these periods in its analysis, acknowledging their existence while recognizing the consumption as effectively zero. This strategy prevents the model from confusing these instances with missing data, thereby improving the accuracy and reliability of the model's outputs.
At this time, BETTER will reject negative energy consumption values and won't generate a change-point model and assess energy efficiency measures (EEM) for that building. BETTER requires 12 consecutive months of positive energy consumption values to assess EEMs.
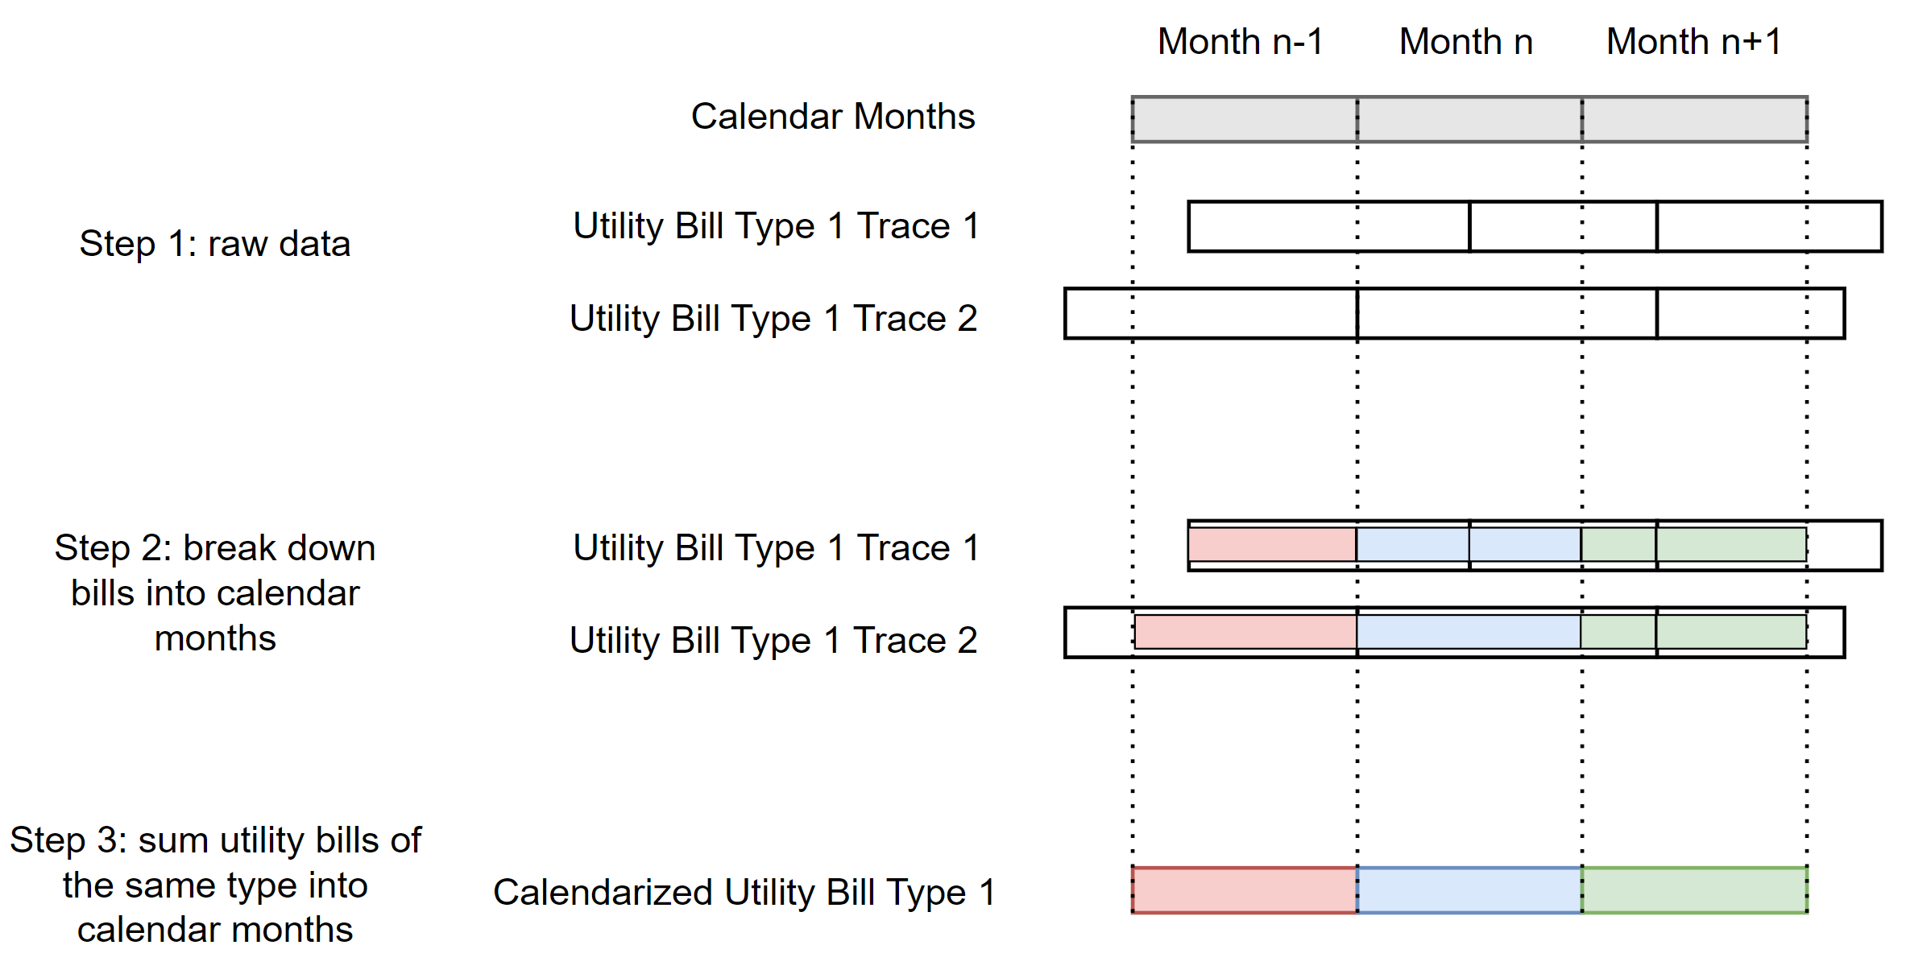
BETTER calendarize utility bills by allocating the energy consumption by calendar months. Specifically, it allocates the energy consumption in a utility bill to each calendar month based on the number of days in each month. For example, if a utility bill covers the period from January 15 to February 15, BETTER will allocate 16/31 of the energy consumption to January and 15/31 of the energy consumption to February. Then, utility bills of the same type (e.g., electricity) are aggregated by calendar month. The subsequent steps of BETTER analytics are performed on the aggregated calendarized utility bills.
The table below summarizes each building space type supported by BETTER, its corresponding API label (also called an enumeration type or enum), the countries where BETTER provides reference benchmark statistics, and the available analysis options for both single buildings and building portfolios. For definitions of these space types, click here. BETTER supports two benchmarking methods:
| Space Type | Enum Name (for API) | Countries with Reference Benchmark Statistics | Single Building (Reference Benchmark Statistics)1 | Portfolio (Reference Benchmark Statistics)1 | Portfolio (Generate Benchmark Statistics)2 |
|---|---|---|---|---|---|
| Hospital (General Medical & Surgical) | HOSPITAL | US | Yes | Yes | Yes |
| Hotel | HOTEL | TN | Yes | Yes | Yes |
| K-12 School | K12 | US | Yes | Yes | Yes |
| Multifamily Housing | MULTIFAMILY_HOUSING | US | Yes | Yes | Yes |
| Office | OFFICE | US, MX | Yes | Yes | Yes |
| Public Library | PUBLIC_LIBRARY | US | Yes | Yes | Yes |
| Worship Facility | WORSHIP_FACILITY | US | Yes | Yes | Yes |
| Adult Education | ADULT_EDUCATION | — | No | No | Yes |
| Bank Branch | BANK_BRANCH | — | No | No | Yes |
| Barracks | BARRACKS | — | No | No | Yes |
| College/University | COLLEGE_UNIVERSITY | — | No | No | Yes |
| Convenience Store with Gas Station | CONVENIENCE_STORE_WITH_GAS_STATION | — | No | No | Yes |
| Convenience Store without Gas Station | CONVENIENCE_STORE_WITHOUT_GAS_STATION | — | No | No | Yes |
| Courthouse | COURTHOUSE | — | No | No | Yes |
| Data Center | DATA_CENTER | — | No | No | Yes |
| Distribution Center | DISTRIBUTION_CENTER | — | No | No | Yes |
| Enclosed Mall | ENCLOSED_MALL | — | No | No | Yes |
| Fast Food Restaurant | FASTFOOD_RESTAURANT | — | No | No | Yes |
| Financial Office | FINANCIAL_OFFICE | — | No | No | Yes |
| Fire Station | FIRE_STATION | — | No | No | Yes |
| Mailing Center/Post Office | MAILING_CENTER_POST_OFFICE | — | No | No | Yes |
| Medical Office | MEDICAL_OFFICE | — | No | No | Yes |
| Museum | MUSEUM | — | No | No | Yes |
| Non-Refrigerated Warehouse | NON_REFRIGERATED_WAREHOUSE | — | No | No | Yes |
| Outpatient Rehabilitation/Physical Therapy | OUTPATIENT_REHABILITATION | — | No | No | Yes |
| Police Station | POLICE_STATION | — | No | No | Yes |
| Pre-school/Daycare | PRESCHOOL_DAYCARE | — | No | No | Yes |
| Prison/Incarceration | PRISON_INCARCERATION | — | No | No | Yes |
| Refrigerated Warehouse | REFRIGERATED_WAREHOUSE | — | No | No | Yes |
| Residence Hall/Dormitory | RESIDENCE_HALL_DORMITORY | — | No | No | Yes |
| Restaurant | RESTAURANT | — | No | No | Yes |
| Retail Store | RETAIL_STORE | — | No | No | Yes |
| Self-Storage Facility | SELF_STORAGE_FACILITY | — | No | No | Yes |
| Senior Care Community | SENIOR_CARE_COMMUNITY | — | No | No | Yes |
| Supermarket/Grocery Store | SUPERMARKET_GROCERY | — | No | No | Yes |
| Urgent Care/Clinic/Other Outpatient | URGENT_CARE_CLINIC | — | No | No | Yes |
| Veterinary Office | VETERINARY_OFFICE | — | No | No | Yes |
| Vocational School | VOCATIONAL_SCHOOL | — | No | No | Yes |
| Wholesale Club/Supercenter | WHOLESALE_CLUB_SUPERCENTER | — | No | No | Yes |
| Other | OTHER | — | No | No | Yes |
1“Yes” indicates that reference benchmark statistics are available for that space type in the specified country.
2“Yes” indicates that user-generated benchmark statistics are supported. This method enables benchmarking within your own portfolio. It is strongly recommended that, when applying this method, users include at least 30 buildings of the same space type with complete data to ensure statistical reliability.
First, see if you can determine the building’s primary space type. This is the space type that accounts for more than 50% of the building. For example, if you enter a building that has an office that accounts for 60% of the gross floor area (GFA) (excluding parking) and a retail store that accounts for 40% of the GFA, then the primary space type will be office. This primary space type is used to determine the peer group for benchmarking in BETTER. If no individual space type accounts for more than 50 % of the building space, then it is mixed use. To evaluate energy savings for mixed use buildings in BETTER, we recommend determining the size and monthly energy usage for each space in the building and benchmarking each of these spaces separately.
R-squared (R2) is a goodness-of-fit measure for regression models. It quantifies the proportion of the variability for a dependent variable that's explained by an independent variable, or variables, in a regression model. In the case of BETTER, R2 indicates to what extent variations in outdoor air temperature explain variations in building energy use intensity. An R2 of 1 means that all changes in energy use intensity is completely explained by changes in outdoor air temperature. In general, we recommend users select an R2 of 0.6 or higher when creating a portfolio or building analytics.
When running BETTER analytics, the R2 threshold sets the minimum goodness-of-fit requirements for change-point models. As a result, when running a portfolio analytics, different R2 thresholds may lead to different results:
In general, we recommend users select an R2 of 0.6 or higher for a portfolio or building.
When analyzing a portfolio or building, BETTER offers users the ability to select an energy savings target based on the scale of savings desired. Users can select from the following targets each time they run an analytical report for a portfolio or a building:
The “reference” benchmark statistics method allows a BETTER user to benchmark a commercial building’s inverse model coefficients (i.e., electric and fossil baseloads, heating and cooling change-points, and heating and cooling slopes) against the median and standard deviation for each of these inverse model coefficients derived from a training dataset. Alternatively, the “generate” benchmark statistics method allows a user with a portfolio of commercial buildings (recommended to be at least 30) of a single space type to benchmark "internally." Thus, instead of comparing a building’s inverse model coefficients to the median and standard deviation of the training dataset, BETTER generates a unique set of statistics (i.e., the median and standard deviation for their own portfolio's electric and fossil baseloads, heating and cooling change-points, and heating and cooling slopes) based solely on the user's input portfolio - so the user is essentially comparing buildings within their own portfolio to identify cost-saving energy performance improvement opportunities. We recommend that users include at least 30 buildings of a single space type when using the "generate" benchmark statistics method of analysis.
We take the following steps to develop U.S. “reference” benchmark statistics for building space types:
We take the following steps to develop international “reference” benchmark statistics for building space types:
We have developed “reference” benchmark statistics for U.S. offices, K-12 schools, libraries, and multifamily buildings; Mexican offices; and Tunisian hotels. We are currently working to develop “reference” benchmark statistics for U.S. libraries. Please contact us at (support@better.lbl.gov) if there is an additional space type for which you would like us to develop “reference” benchmark statistics. Click on this ( link ).
At this time, the U.S. “reference” benchmark statistics are not perfectly representative of the U.S. national stock because the statistics were not developed from the U.S. Energy Information Administration (EIA) Commercial Building Energy Consumption Survey ( CBECS ) nor the U.S. EIA Residential Energy Consumption Survey (RECS ) datasets, which are representative of the U.S. national stock. Instead, these statistics were developed utilizing training datasets developed based on voluntary contributions from U.S. industry that are not fully representative of the U.S. national stock in terms of characteristics such as size and climate zone distribution. We are working to expand these training datasets, and hence improve associated “reference” benchmark statistics, so they are more representative of the U.S. national stock. This includes expanding the training data sets to include: at least 30 data points for each of the 10 BETTER model coefficients for each of the ( CBECS size categories) in each of the ( eight International Energy Conservation Code (IECC) climate zones) in the United States (and possibly for each of the relevant subtypes A, B, and C in these zones). To contribute anonymous data to this effort, please email ( support@better.lbl.gov). Additionally, at this time, “reference” statistics are only available for U.S. offices, K-12 schools, libraries, and multifamily buildings, but we are gradually adding other space types (beginning with U.S. multifamily). To know more about the benchmark statistics development process, click on this ( link ).
Use of BETTER's analytical engine with over 700 buildings globally indicates that a portfolio size of 30 buildings is generally sufficient in order to "generate" benchmark statistics and benchmark a portfolio "internally" (i.e., compare buildings within a portfolio and not against "U.S. reference" benchmark statistics to identify cost-saving energy performance improvement opportunities). This means that a portfolio size of 30 allows BETTER to generate two inverse models for each building in the dataset (one electric and one fossil); extract inverse model coefficients; anf fit a normal distribution to the extracted inverse model coefficients that passes the KS test). This being said, we know that some building portfolios are highly uniform in terms of the use of electricity and fossil energy for baseload, heating, and cooling, and a smaller portfolio of 20-25 buildings could generate robust benchmarking statistics for "internal" benchmarking. In other cases, where portfolios have missing data points or variations in outdoor air temperature do not significantly explain variations in energy use intensity, then a portfolio size of 30-50 buildings may be needed to deliver viable statistics for "internal" benchmarking. However, overall work to-date on BETTER's analytical engine for 700 buildings suggests that 30 buildings "generates" benchmark statistics sufficient to identify buildings in a portfolio with energy saving potential and the set of energy efficiency measures that should be implemented to capture these savings. See the links below for case studies of portfolios that benchmarked "internally" to reduce energy usage and costs.
BETTER offers analysis in both unit systems, and a user can easily switch between the two unit systems in the BETTER web app. Go to the upper right corner of the upper navigation bar of the web app to select the unit system in which you want to enter/view data in BETTER. To view/enter data in the metric or international system (IS) of units (kWh, square meters, °C), select SI. To view/enter data in the imperial system (IP) of units (kBtu, square feet, °F), select IP. You can change the system in which you view/enter data in BETTER at any time by changing the unit system in the upper right corner of the navigation bar.
Change-point model fit is influenced by various factors, including data availability, weather-sensitivity of the building's energy consumption, and operating schedule, etc. Typical reasons for no model-fit include: lack of sufficient energy consumption data (i.e., less than 12 consecutive months); the energy use intensity (EUI) for the building is not weather-sensitive; the energy consumption data entered includes data for the COVID shutdown period and is, therefore, irregular.
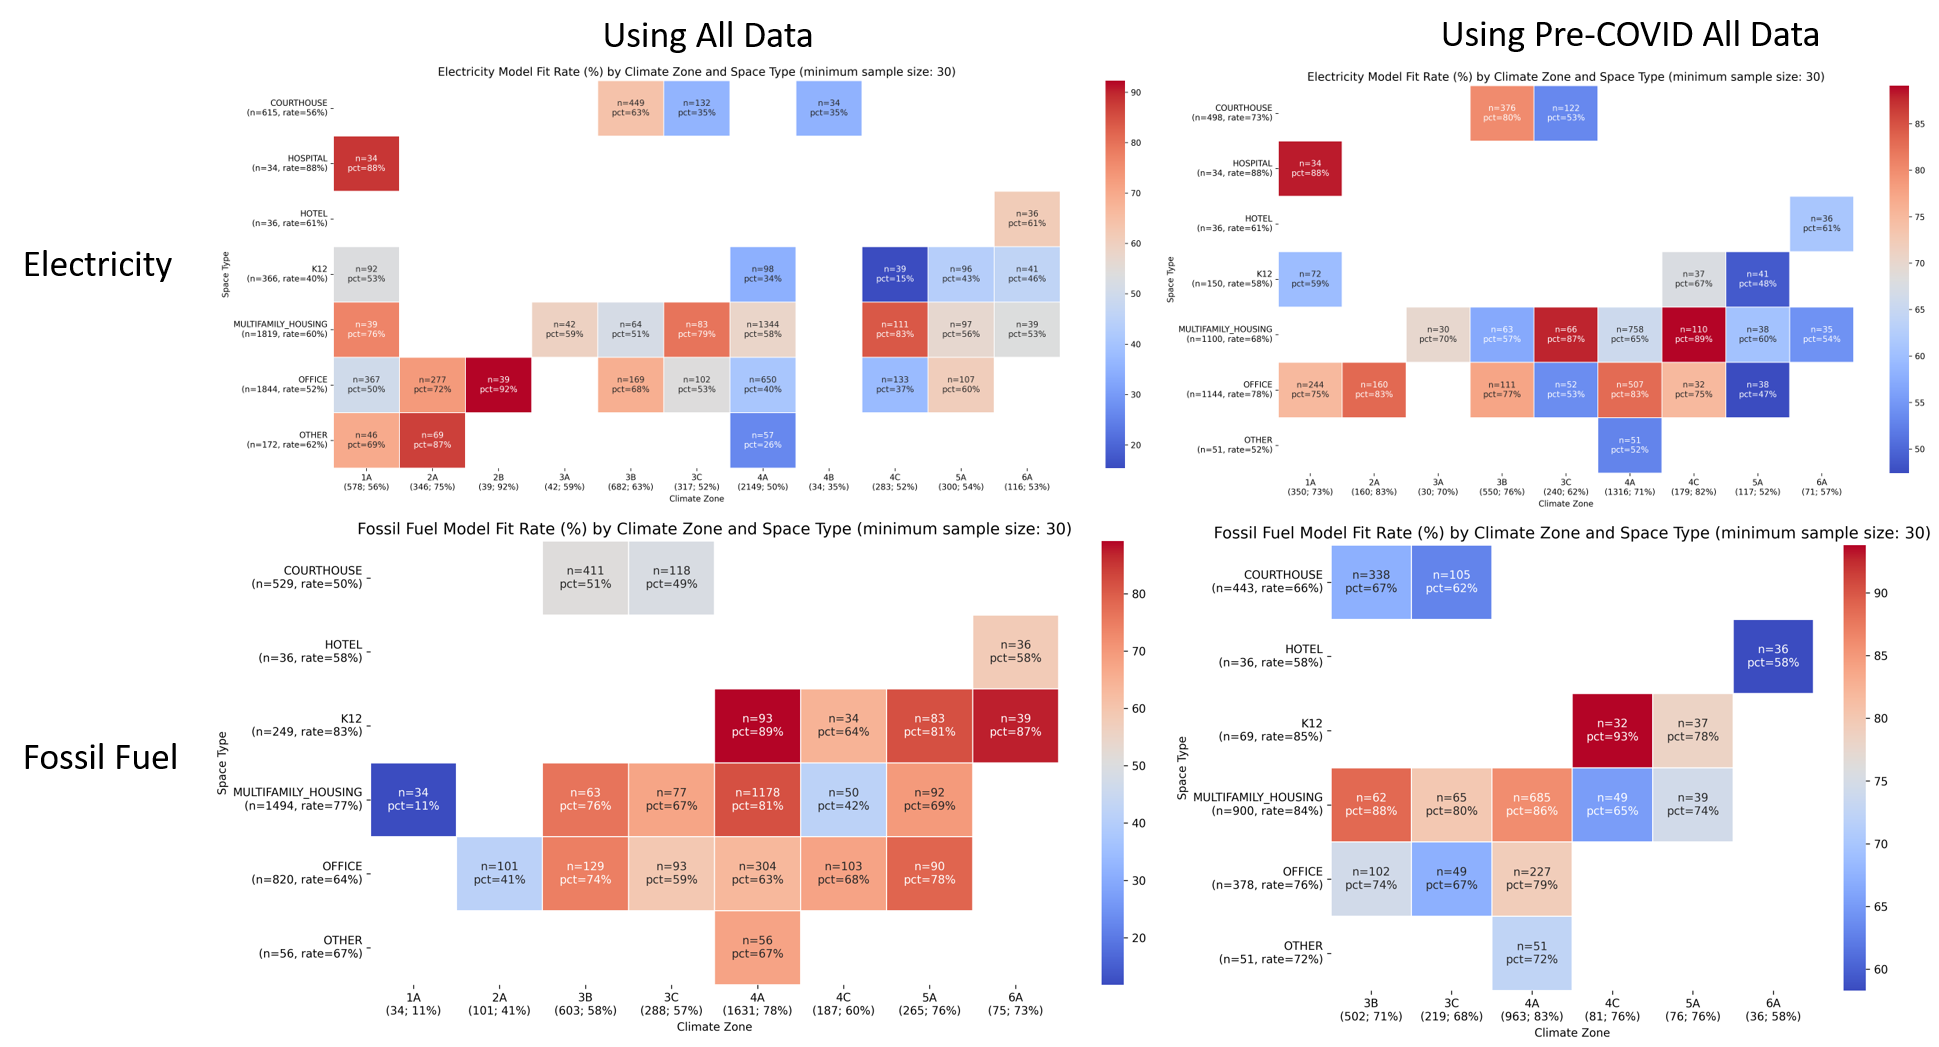
According to our analysis of all user-entered anonymous data by the end of 2023, the change-point model-fit rate varies by space type, location, and the time of usage (e.g., pre-COVID vs. COVID). The heatmaps below compares the model-fit rates of buildings of different space types and climate zones, where each cell shows a "space type & climate group." To avoid randomness and ensure reasonable comparisons, at least 30 buildings with at least 12-months of consecutive utility bills are required in each group to be included. Each cell shows the number of buildings with enough utility bill data and the percentage of buildings that have a valid change-point model (i.e., 1P, 3P or 5P). It can be seen that the model-fit rates are generally lower if all data, including the COVID period data, is used. Using pre-COVID data increased the model-fit rates in most cases. This is because some buildings' operating schedules changed drastically after COVID, whereby the buildings' energy consumption patterns were no longer correlated with weather. For more details, please refer to the link .
If a model can't be fit on the first try for a building, consider doing one of the following and re-running the analytics:
At this time, BETTER cannot provide estimated energy, cost, and GHG emissions reductions associated with implementing a single energy efficiency measure (e.g., envelope retrofit). However, BETTER will identify which energy efficiency measures (from a total of 15 measures, ranging from lighting upgrades to envelope upgrades) your building could benefit from, and the total energy, cost, and GHG emissions reductions that could be achieved from implementing all of BETTER's recommended energy efficiency measures in your building or portfolio.
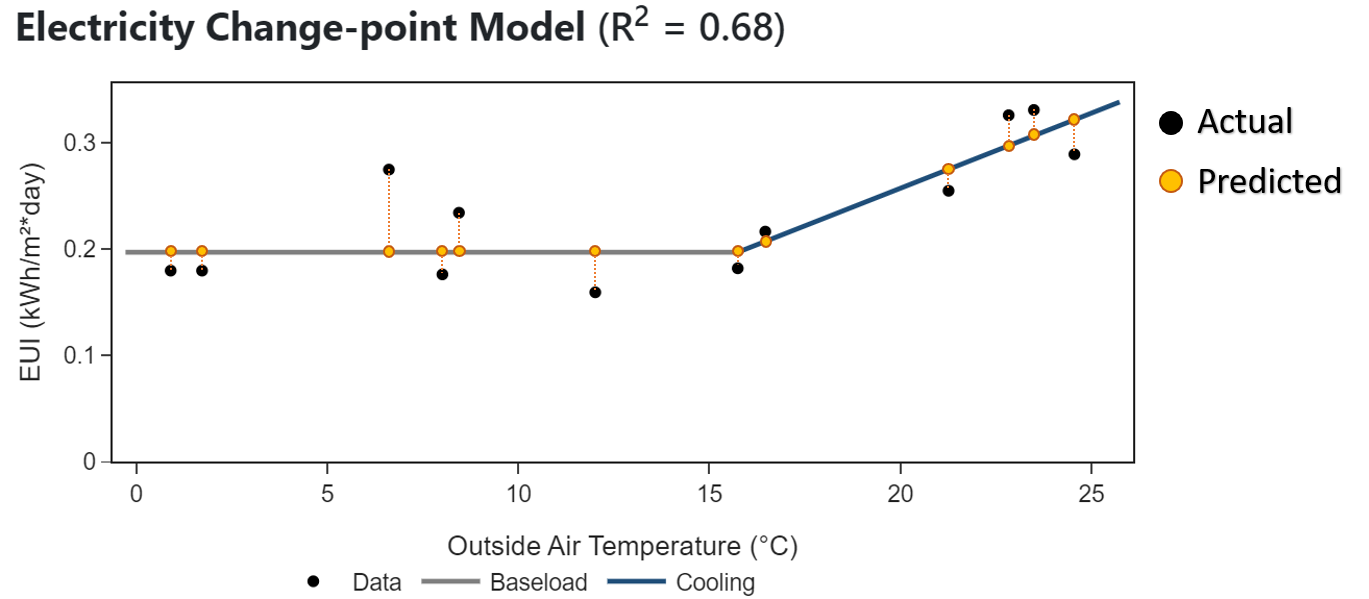
BETTER utilizes data-driven techniques to analyze a building's monthly energy consumption in response to weather conditions. Change-point models are fitted between daily energy use intensity (EUI) and outdoor air temperature to determine the weather-sensitive and weather-independent components of electricity and fossil fuel energy consumption, respectively. The energy consumption values reported are predictions generated by the change-point models, which may differ from the actual entered values. The figure on the right displays an example change-point model, where the black dots represent the actual EUI, and the orange dots represent the predicted EUI. Generally, a better change-point model results in smaller discrepancies between the entered and predicted energy consumption values.
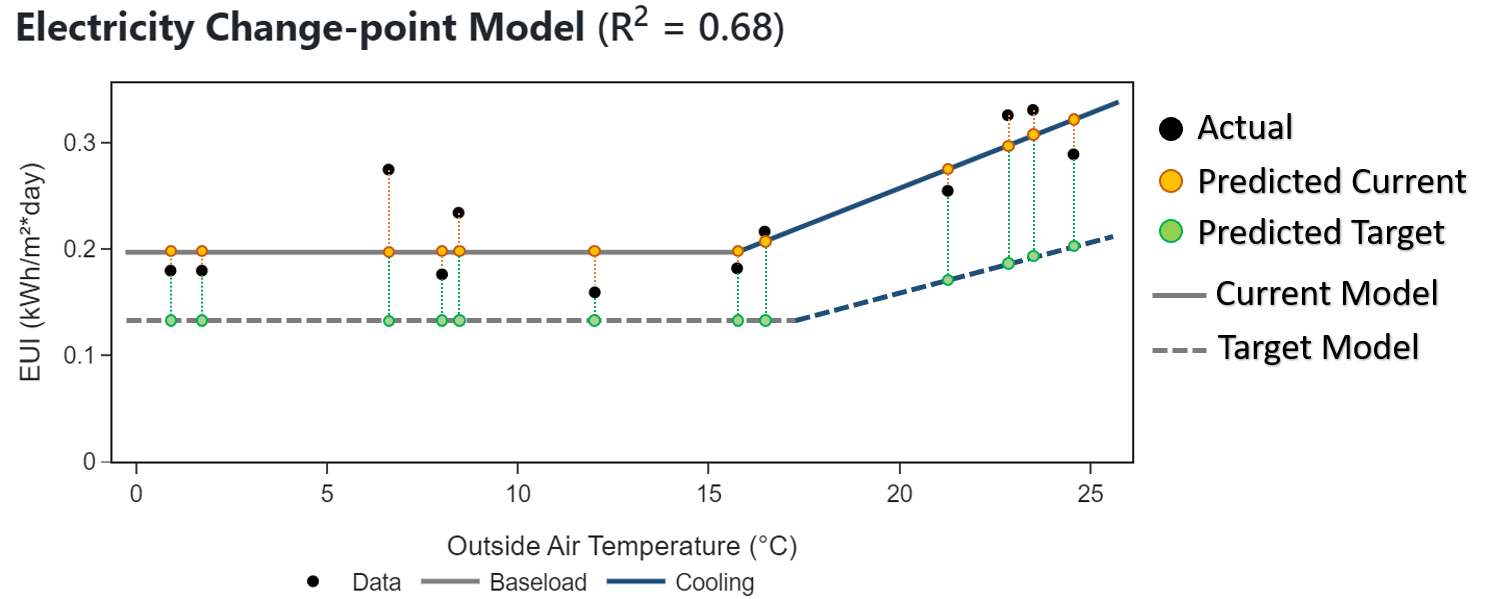
Continuing from the previous example, the figure demonstrates how change-point models are utilized to predict the current and target levels of EUIs. These values are then used to estimate energy consumption and calculate savings. The solid lines in the figure depict the current change-point model fitted using actual data, while the dashed lines represent the target change-point model, which shows the improvement in coefficients to reach the target level. In this example, the baseload is reduced, the cooling change-point is shifted to the right, and the cooling slope is made less steep. The current level EUIs (represented by orange dots) and target level EUIs (represented by green dots) are predicted using the actual monthly average outdoor air temperatures. Finally, the predicted EUIs are utilized to estimate annual energy consumption and calculate savings using the formula below (note that the summation is over the last 12 months):
Σ[(EUIcurrent - EUItarget) × floor_area ×
                                    number_of_days]
The estimation of PV sufficiency and Net Zero Energy (NZE) potential is based on the assumption that PV-generated electricity can be consumed at any time. This means that the total amount of electricity generated by the PV system over a period (e.g., a year) is assumed to be fully available to meet the building’s electricity demand at any time during that period. However, it's important to note that this assumption may not always hold true in practice. In reality, the generation of electricity from PV systems and the building's electricity demand are often mismatched in time. For instance, PV systems generate electricity primarily during daylight hours, whereas the building’s peak electricity demand might occur in the evening. This temporal mismatch can lead to situations where excess PV-generated electricity during the day cannot be utilized immediately and may need to be stored or exported to the grid, while the building may still need to draw electricity from the grid during times of low or no PV generation. As a result, the actual PV sufficiency and NZE potential might be lower than the estimated values if storage solutions or grid interactions are not effectively managed. By considering these factors, BETTER provides an initial estimation that helps identify potential benefits of PV integration, but it also highlights the need for detailed analysis and planning to address the temporal mismatch between PV generation and building energy demand.
BETTER is currently available in English, Spanish and French.
Your use of the BETTER web application (app) and application programming interface (API) is subject to the following terms and conditions: the BETTER web app and API are operated by Lawrence Berkeley National Laboratory (LBNL), a U.S. Department of Energy (DOE) national laboratory managed and operated by the University of California ("LBNL" and "Berkeley Lab") engaged in fundamental, unclassified research in the public interest. By using the web app and API, you agree to abide by the BETTER Data Privacy Terms and the terms of the LBNL privacy, security, copyright, disclaimers, and accessibility information, this Use Agreement, and the terms described herein. You also acknowledge that the data in the BETTER web app and API is subject to error and may not be accurate enough for your application. You agree not to hold the developers, contributors, hosts of the BETTER web app and API, the Regents of the University of California, and the U.S. DOE liable for any inaccuracies in the data, or consequences thereof, or for any claims brought by any third party regarding their data contributions. Analytical output reports generated using BETTER models stored on LBNL and BETTER's systems may potentially be subject to Freedom of Information Act (FOIA) or the California Public Records Act (CPRA). We recommend that users download and save analytical reports to their own local system rather than storing them in the BETTER system. Please email support@better.lbl.gov with questions.